Calendar Rollup - Integrate SharePoint, Google, Exchange and External calendars into one view.
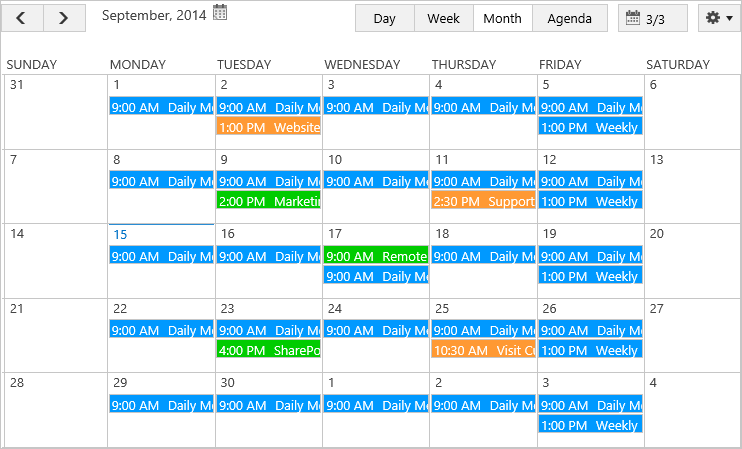
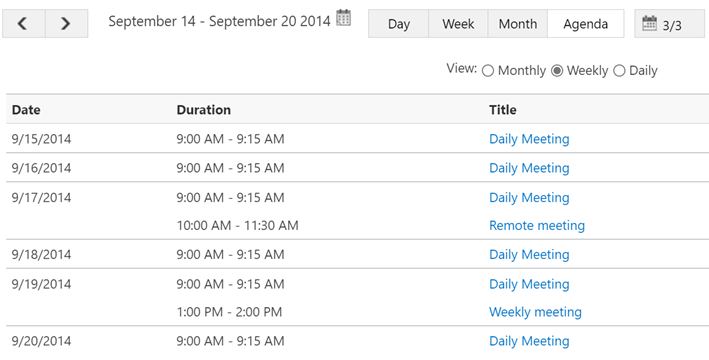
Collect Calendar into One View
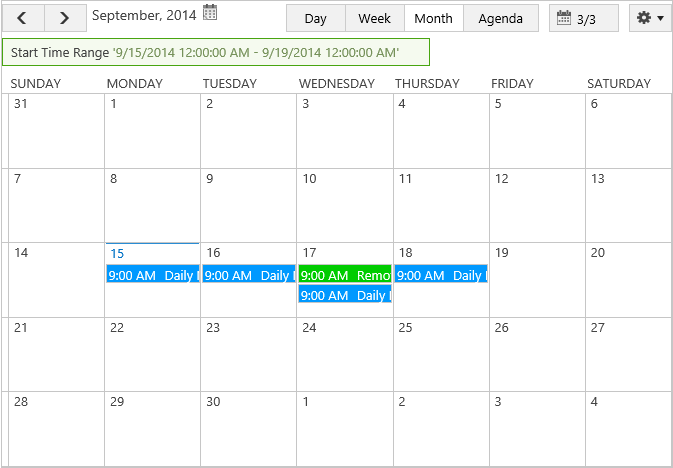
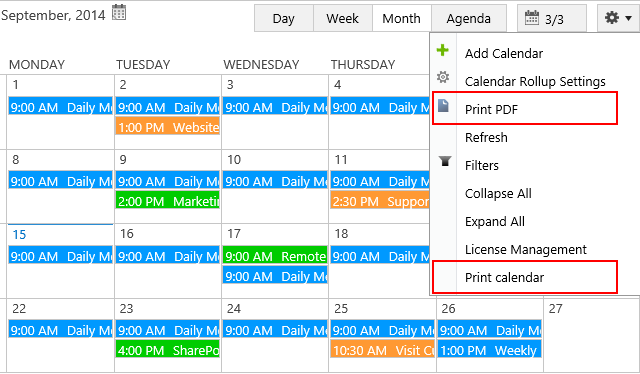
Roll-up and organize calendar events from SharePoint, Exchange(2007SP1, 2010, 2013, 2016, 2019 and Exchange Online), Google and External Content Type into one calendar.
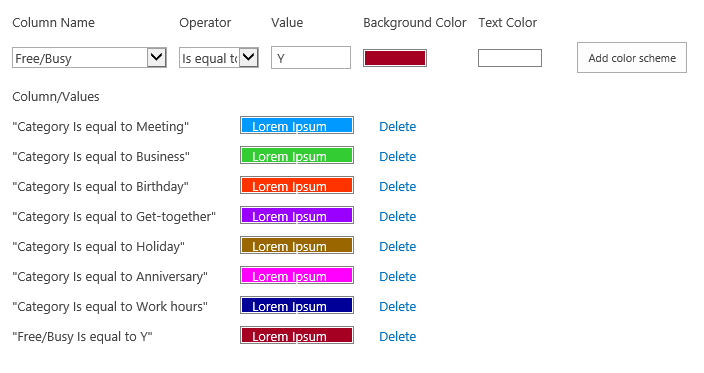
Color Code Events
Color code calendar events based on different event sources, event types or list column values, easy to identify the events.
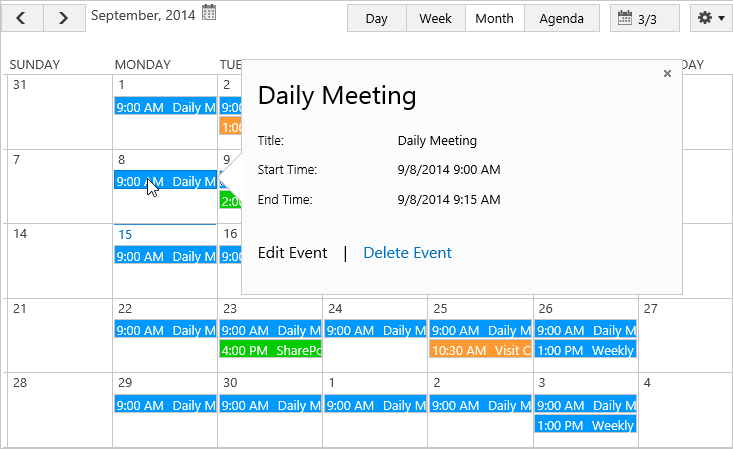
Quick Access to Event Details via Tooltip
Define columns to be displayed in a tooltip interface when a user hovers over events, this allows users to retrieve essential information quickly.
Filter Events by Conditions
Filter events based on the column value and conditions to quickly track events.
List Collection - Collect and consolidate data from multiple lists into a single view.
Aggregate Data from Different Sites
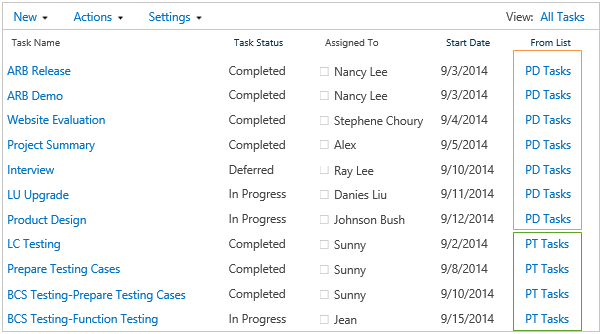
Pull items from lists in different SharePoint sites for a combined view, making it easier to access, manage, sort, analyze and share data.
Various Views Available
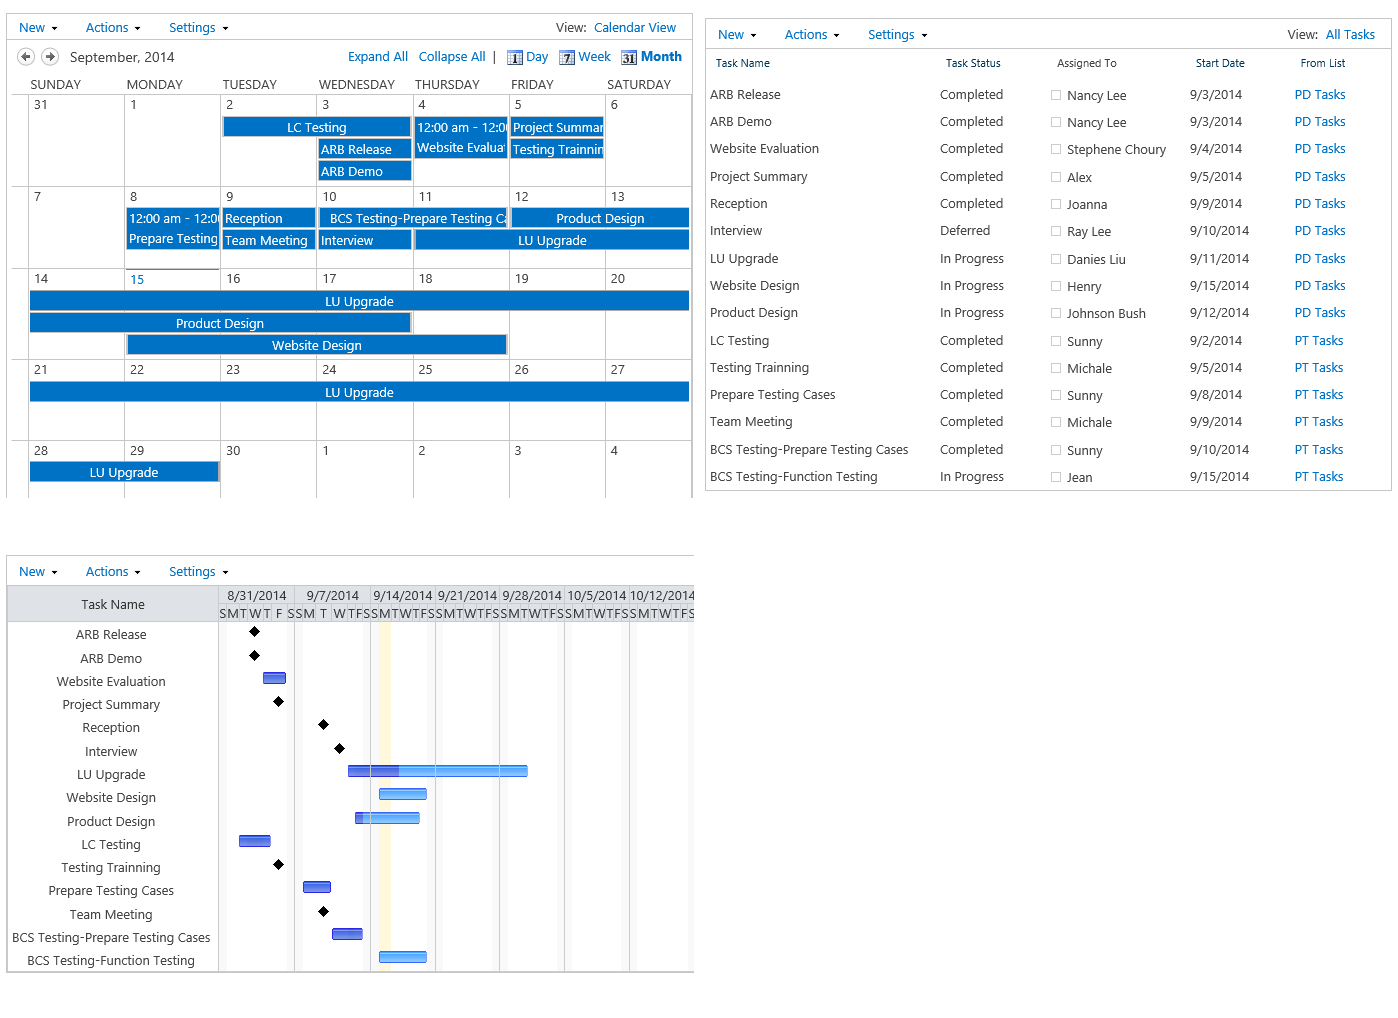
Standard, Calendar or Gantt view is available to organize, display, filter, sort or group data the way you want. Users can create public or personal views as well.
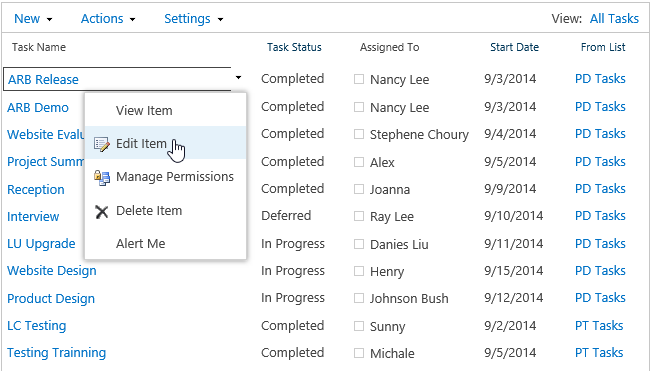
Manage Items in the Web Part
Be able to manage an item including create, edit, delete, send an Alert Me email and etc. directly in the Web Part.
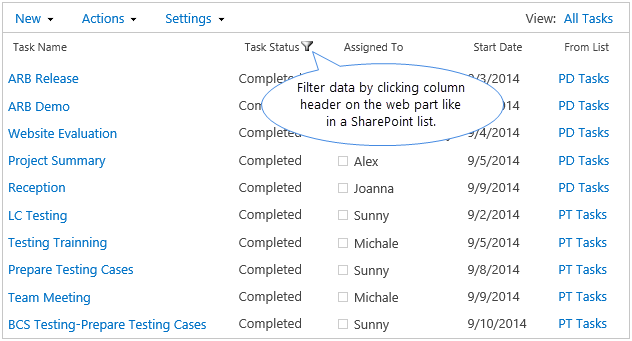
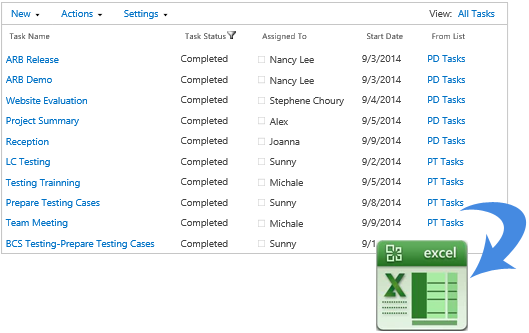
Filter Items on the Web Part
Filter items by clicking the column headers just like SharePoint’s behavior. Even better, it can be connected to a SharePoint filter Web Part to filter data.
Business Charts - Easily create dynamic & interactive charts based on various data sources in just a few minutes!
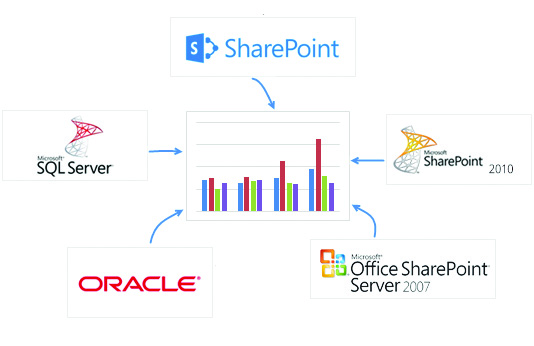
Generate charts using data source
Retrieve data from multiple data sources to generate charts, including SharePoint list, SQL server tables or views and Oracle Database.
Multiple Chart Types Supported
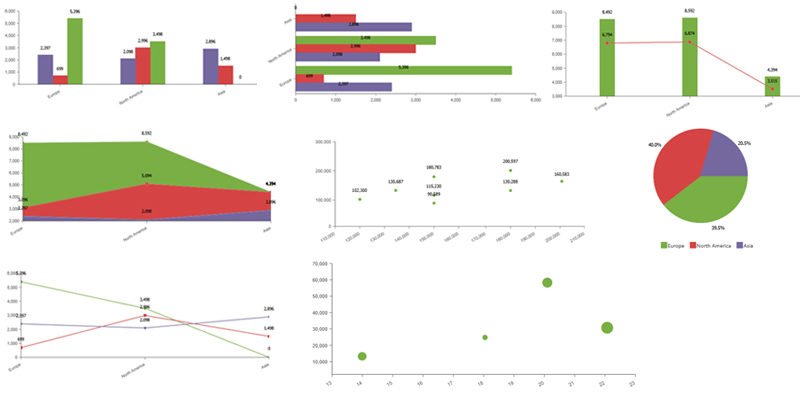
8 common chart types are offered in Business Charts: Bar, Column (Stacked Bar), Line, Area, Pie, Combo, Scatter and Bubble. In the chart, users can customize the data series and compare the data by overlaying multiple data series.
SUPPORT GROUPING AND AGGREGATION
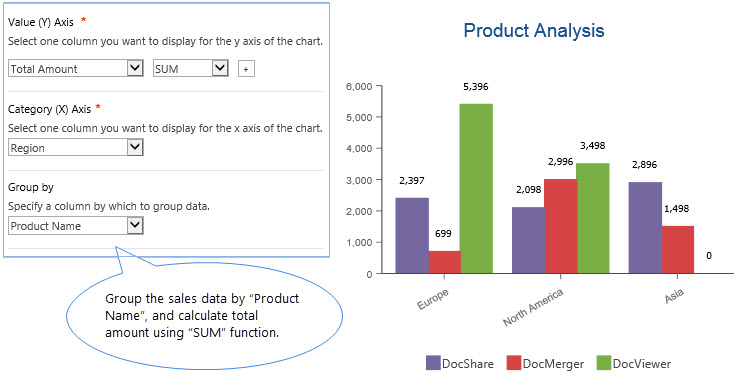
Using the grouping function, users can organize and group data in any way they want, irrespective of how it is originally stored in SharePoint. Aggregate functions are available for computing aggregate values (like sum, average, count, max, min etc.).
GROUP DATA BASED ON INTERVAL
Business Charts provides an easy way to group data depending a Date and Time field. Users can group the data according to the predefined interval, including year, quarter, month, week, day and hour, thus showing data changes over a period of time or illustrating comparisons among items.
FILTER DATA ON CHART
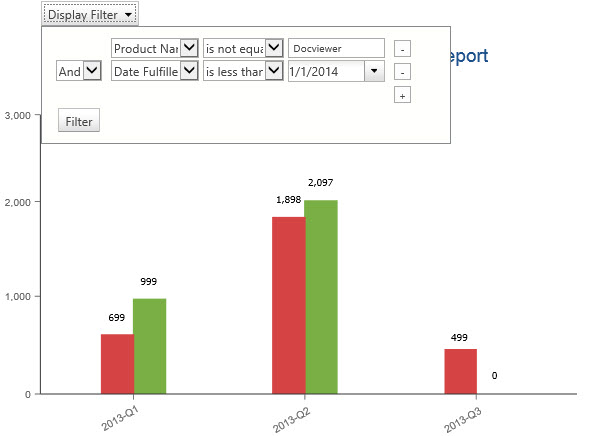
After creating a chart on SharePoint, users can define filters to create a dynamic chart. Logically, comparison and date filters can be specified on the data series to narrow down and refine data to be plotted on the chart.

