- BoostSolutions
-
Products
-
- Microsoft Teams
- HumanLike Alert Reminder
- View All Apps
- Pricing
- Support
- Company
Create powerful charts, quickly and easily
Formidably improve data analysis and decision making

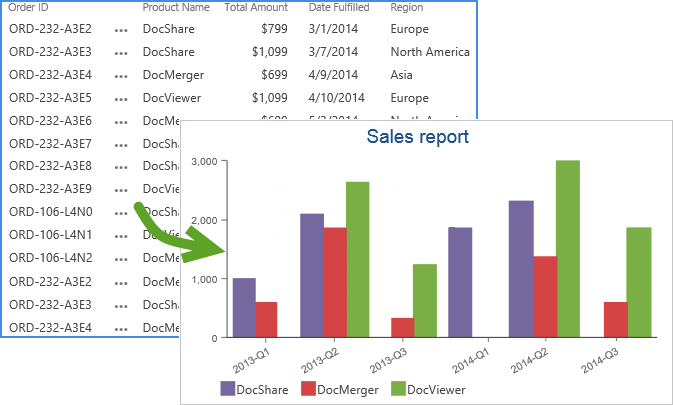
SharePoint Business Charts provides a quick and easy way to create a chart or graph in SharePoint list. Using the step-by-step wizard, users can configure grouping, aggregate and filter functions to create the desired chart. Even better, the data or chart can be exported to Microsoft Excel or printed for offline use.
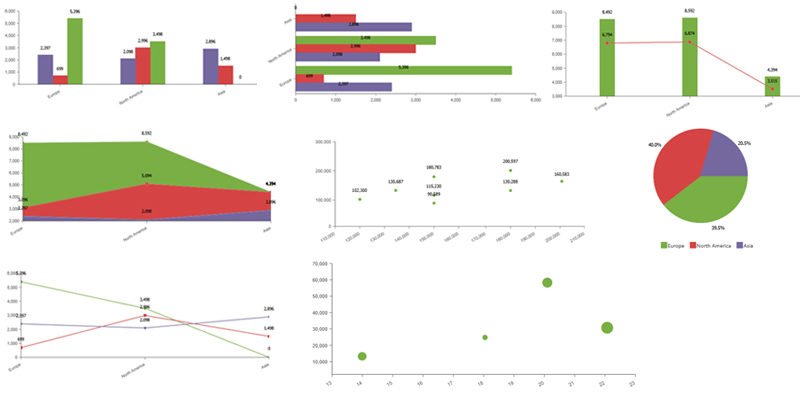
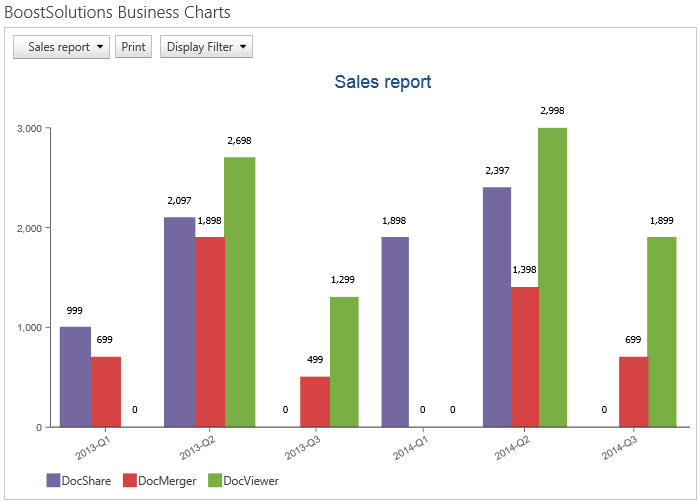
8 common chart types are offered in Business Charts: Bar, Column (Stacked Bar), Line, Area, Pie, Combo, Scatter and Bubble. In the chart, users can customize the data series and compare the data by overlaying multiple data series.
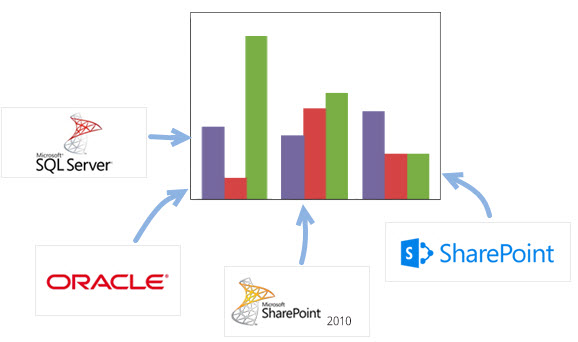
Business Charts can create charts from various external data sources, including SharePoint lists, views (different site collections or farms), MS SQL and ORACLE. Thus users can easily analyze data from other business applications on SharePoint.
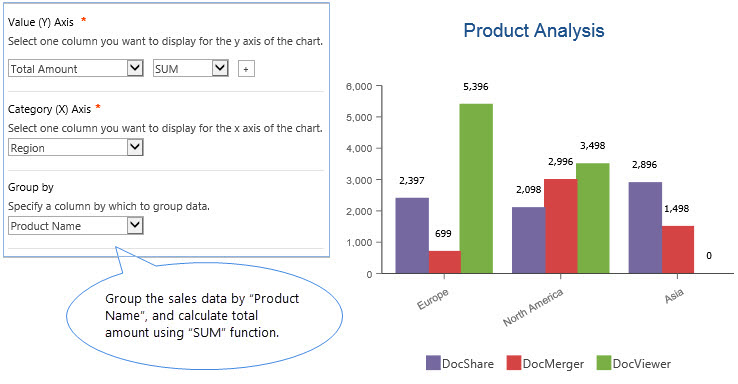
Using the grouping function, users can organize and group data in any way they want, irrespective of how it is originally stored in SharePoint. Aggregate functions are available for computing aggregate values (like sum, average, count, max, min etc.).
Learn More

Business Charts provides an easy way to group data depending a Date and Time field. Users can group the data according to the predefined interval, including year, quarter, month, week, day and hour, thus showing data changes over a period of time or illustrating comparisons among items.
Learn More
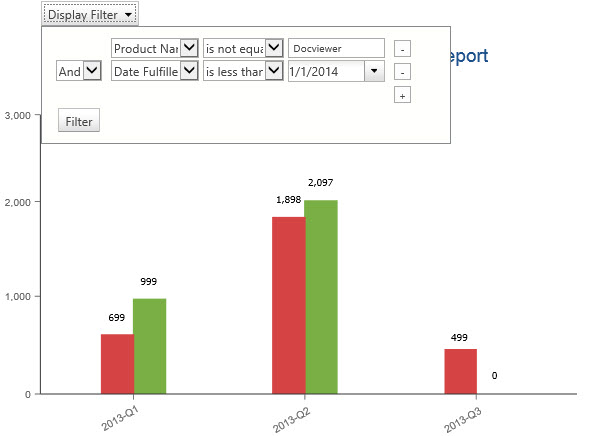
After creating a chart on SharePoint, users can define filters to create a dynamic chart. Logically, comparison and date filters can be specified on the data series to narrow down and refine data to be plotted on the chart.
Learn More
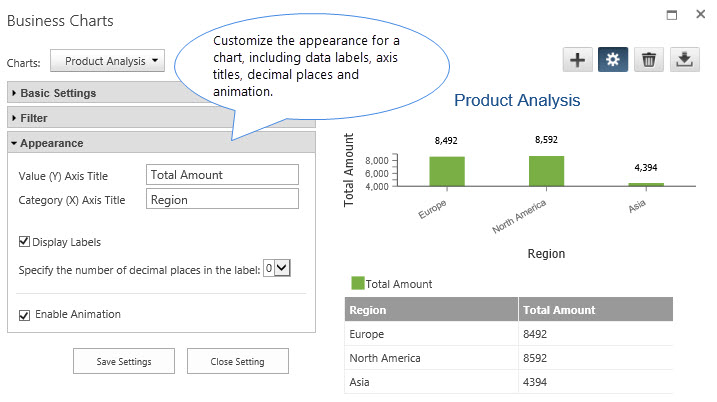
Business Charts enables user customization that changes the appearance of a chart and makes charts easier to understand and more readable. Users can specify data labels, axis titles, decimal places and animations for their charts.
There are two ways to create a chart in SharePoint: in List or by Web Part. By adding the Business Charts Web Part on any page, you can create a chart or report, making it easier to share information with your team.
Explore BoostSolutions' product user guides, releases, tutorials, and more.
