SharePoint is the perfect business data container, but the data is not easy to read. Reporting and visualization of data is the only way to turn the data into usable information. Charts and Indicators are some of the ways to make such data easier to understand. The Business Intelligence Center is one of the templates shipped with SharePoint Server 2010. It is optimized to help you manage the working elements of business intelligence reporting: scorecards, dashboards, data connections, status lists, status indicators, etc.
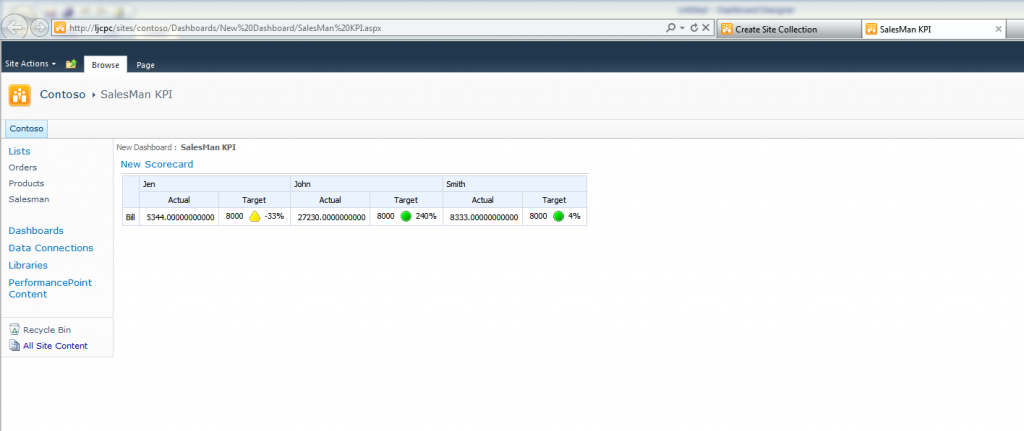
In this article I will show you how to use Dashboard Designer to create a dashboard that displays a sales performance scorecard. The final result will look like this:
Here are the steps we need to get it done.
I. Configure the PerformancePoint Service in SharePoint.
II. Open Dashboard Designer from the SharePoint Site.
III. Create a Data Connection in Dashboard Designer.
IV. Create a Scoreboard in Dashboard Designer & Create and Deploy the Dashboard.
But before going forward on this issue, we need a Business Intelligence Center site and a List as the data source for this scoreboard.
Here is the data in the SharePoint List “Orders.”
I. Configure the PerformancePoint Service in SharePoint
Before you can use Dashboard Designer, you need configure the PerformancePoint Service to make sure it can be accessed by Dashboard Designer.
Central Administration>Appication Management>Manage service Applications>PerformancePoint Service Application> PerformancePoint Service Application Settings
In this setting page, you can find the section named “Secure Store and Unattended Service Account”, enter a username and the password as the account when use Dashboard Designer accessing the SharePoint.
II. Open Dashboard Designer from SharePoint Site
If you have never used Dashboard Designer before, here is how you can get it.
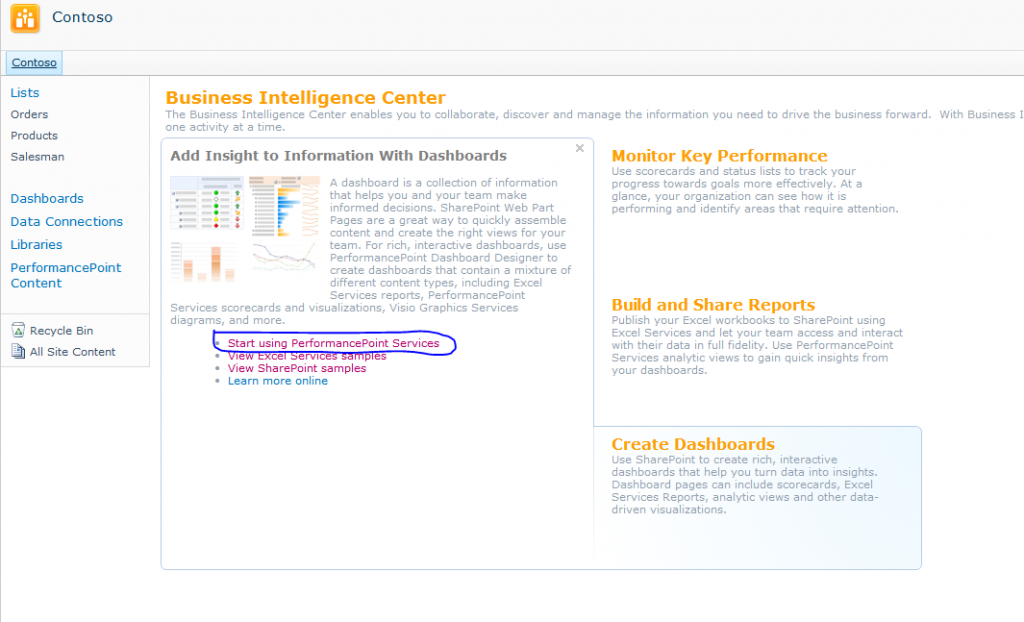
Open the home page of the Business Intelligence Center, and move your mouse over the third tab “Create Dashboards“, then click the link “Start using PerformancePoint Services“.
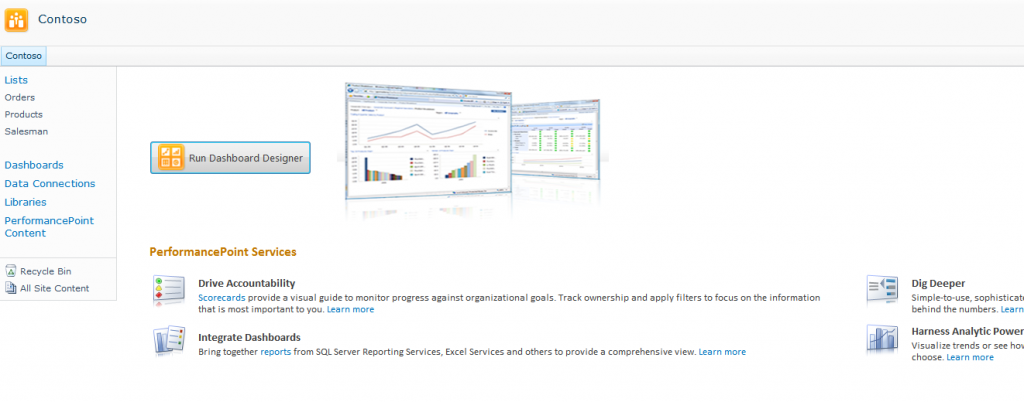
Click the button “Run Dashboard Designer” and wait for a few minutes before Dashboard Designer will open.
And after these operations, you can find the this program in this way:
Start>All Programs>SharePoint>PerformancePoint Dashboard Designer
But this method cannot work if your default internet browser is not IE .
III. Create a Data Connection in Dashboard Designer
Before you can use this designer to create a scoreboard, you need the data in your SharePoint site can be accessed locally. That is why we need a data connection to the List here.
Create a data connection by following these steps:
- Open Dashboard Designer. On the Create tab of the ribbon, click Data Source. The Select a Data Source Template dialog box opens.
- In the Select a Data Source Template dialog box, select the Tabular List category and then select the SharePoint List template. This template is based on multidimensional data that is available in SharePoint List.
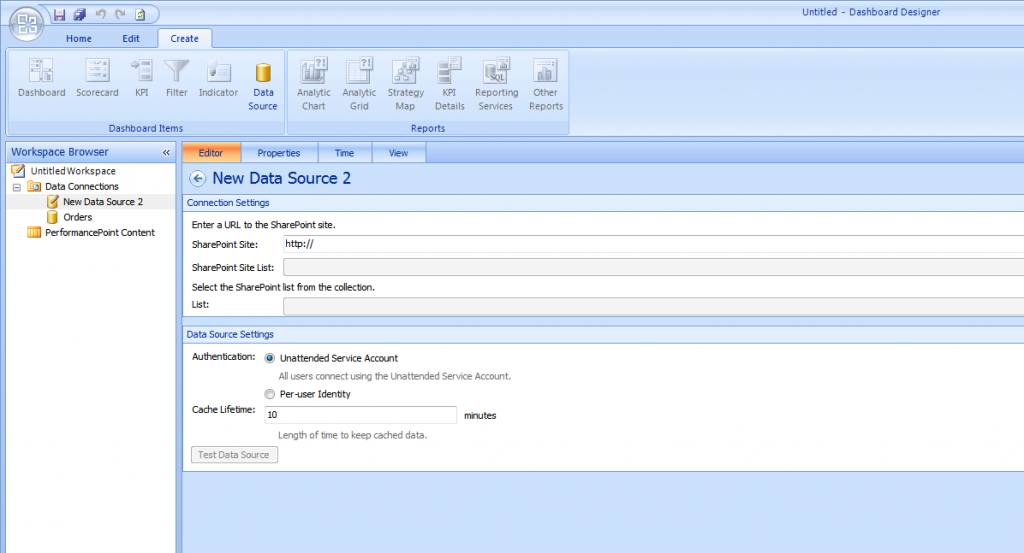
- Click OK to close the Select a Data Source Template dialog box. The properties of the data source will be displayed like the picture below
Before editing anything, select the Unattended Service Account in Authentication section first to make sure we can get the access to SharePoint Web later. Then type in the url of you web, select All Lists for SharePoint Site List, then in the List dropdown, select which list you want as a data source. Ok, now you have created a data connection to a SharePoint List, you can switch to view tab to preview the data in that list.
IV. Create a Scoreboard in Dashboard Designer & Create a Dashboard and deploy it to SharePoint Site
Now everything is ready for creating a scoreboard. This is the most complicated step, but I won’t write it myself. Because I have found a perfect post about this, you can find it here
Although it is using a data source from sql server to create a scoreboard, there is really no difference when you use a data source from SharePoint list as a replacement.


